Light Bot
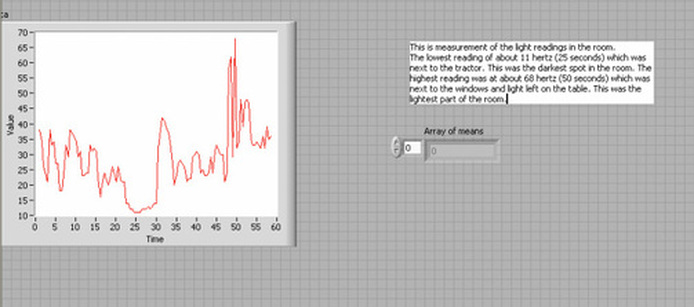
The graph above shows the light as a function of time. At t=50 secounds the light on the graph reaches its maximum brightness.
Hypothesis: I believe that the graph will show a steady increase into the spot where the highest concentration of light is.
Outcome: The graph actually showed a skewed graph because of all the different light levels in the room i had not accounted for.
Hypothesis: I believe that the graph will show a steady increase into the spot where the highest concentration of light is.
Outcome: The graph actually showed a skewed graph because of all the different light levels in the room i had not accounted for.
